While working in an Agile team and delivering frequent releases, one key lesson learned I learned from a specific release was how a performance issue can leave the team working under a tight time schedule. It even resulted in the code needing to be re-released, which could have been avoided.
Having performed Root Cause Analysis (RCA) and a lessons learnt session, the problem in this case was due to a simple database performance issue. Namely, a query was taking more than a minute to fetch the data, which was easily resolved by dropping and recreating the indexes on the specific table.
There were no specific database performance tests carried out. However, the slow query was frequently used by the Graphical User Interface (GUI) front-end and there were a couple of acceptance and user journey tests created which invoked it.
These tests were regularly executed as part of testing and ran without reporting any functional errors. However, in all the test reports, it was only the pass/fail result and any debug log information for observed errors that was validated.
There was never any emphasis on the execution time of the test (i.e., how long each test had taken to run). Had these test execution time metrics been considered and graphed over a period of time and/or per build over a number of releases, the issue would have been evident and stopped it making it through to a production release.
Missed opportunity
Clearly the performance issue would have been obvious to any observer physically running these tests. However, since the tests ran unattended overnight with only the pass/fail result being validated, and not the execution time, it went unnoticed. So in short, the specific issue could have been spotted earlier had we utilised the test execution times from the test reports.
After the RCA and lessons learnt session, some time was spent researching how to use the test execution metrics from the daily/overnight builds to build a set of graphs over a period of time or for each build vs release, etc. Also in an article by Steve Souders on the importance of Frontend (Web Page) Performance, the author talked about the “Performance Golden Rule" that “80-90% of the end-user response time is spent on the frontend” and to “start there."
Thus, irrespective of where the performance issue is, from the above scenario, through a back-end database query found by specifically testing and monitoring the end-user response times on the front-end, if you run the tests and have the metrics available for their execution, it is important to track and monitor the test results.
Questions to ponder
How can the benefit of the individual test execution times produced by the available test reports (Junit/XML/Nunit etc.) be best utilised and maximised, for instance, through the continuous monitoring of test metrics?
Additionally, if the existing GUI tests are enhanced with a focus on Non-Functional Testing, what are the considerations in terms of responsiveness and latency?
Some ideas:
- Loading speed for login
- Landing page response time
- Specific GUI components loading on page
- Query response times (being retrieved from a Database Server)
- Generic sorting/filtering of a tabular data (with a large number of rows/columns)
- Time to generate and load a report from various systems
- Or purely for the visibility and monitoring of test results for the Agile teams (on pass/fail metrics dynamically being updated onto a Dashboard)
Making better usage of test execution time
As a mechanism for making better use of test report metrics, the Jenkins Junit/TestNG plugin offers a good starting point but is not sufficiently interactive or customisable.
It would be possible to create a bespoke solution, involving storing all of the test results in a database and retrieving them back onto a custom dashboard, but this would cost time and resources to build and maintain. A simple and effective low cost solution would be more attractive.
The Eureka moment: Often, Operational IT teams rely on dashboards displaying graphics and charts to track the availability of various Hardware/Software systems, created using a combination of the InfluxDB (a time-series database) and Chronograf or Grafana (the open platform for analytics and monitoring). By adapting this approach to capture and monitor the execution time of existing automated tests over a period of time, a simple and effective solution seems possible.
Through the addition of tags, it is possible to generate lots of metrics and variances, and then through the integrations with either Chronograf/Grafana, produce dashboards that are visibly interactive and great for monitoring.
Continuous monitoring of test results
An added benefit is that this solution fits perfectly into the CI/CD cycle. Once overnight tests have been run, the results can be sent directly to the InfluxDB by the build server using post-build steps, with the Chronograf/Grafana Dashboards dynamically charting the data each build, making it readily available for continuous monitoring.
In the following figures, there are some examples of the types of charts that can be displayed on the dashboard:
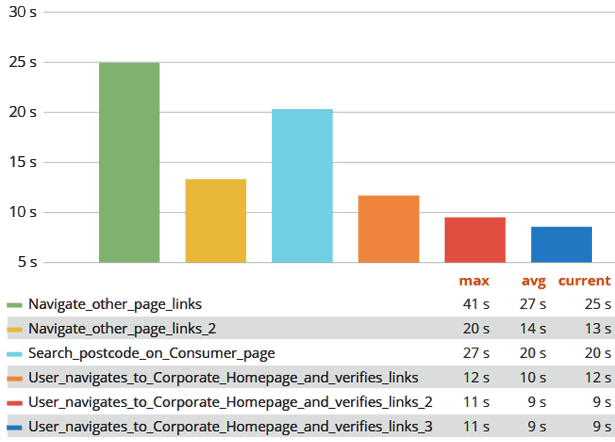
Fig 1. User journey tests with Max/Average/Current response times
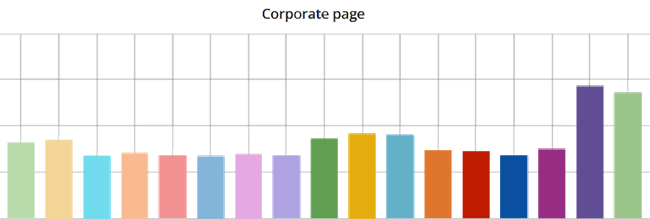
Fig 2. Example of a single test execution time per #Build
Key lessons learned and takeaways
- The InfluxDB / Grafana combination can be a great addition, and is simple to install and configure.
- Integrates easily into a CI/CD cycle by simply adding a post-build step after overnight test execution.
- Initially start by just posting the metrics from existing test report(s).
- Subsequently add further specific GUI tests to do more Non-Functional Tests (NFTs) or enhance existing tests to generate more metrics for monitoring.
- The dashboards and metrics are widely accepted and appreciated by the all stakeholders.
- Thus, the journey towards Continuous Monitoring of Test Results can begin.
In summary
Using this approach, it is possible to make the most of existing test report metrics to compare test execution runs or, with a small amount of enhancement of new or existing GUI tests to emphasise Non-Functional use-cases early in the cycle, the responsiveness and latency of the web page can be monitored with a focus on the client-facing performance.
Please note that Planit is tools agnostic and the references in this article are specific to the above scenario. There are other open-source and commercial tools that are available for similar purposes.
If you need more information, contact us to find out how our consultants can help setup the continuous monitoring of test results and reap the benefits of client-side performance testing.