The Planit Testing Index provides industry-leading analysis into the state of software development projects based upon an unparalleled cross-section of software projects from Australia and New Zealand. Now in its ninth year, the 2015 Index received 281 respondents from a wide range of industries/sectors; those best represented including financial services, government, software development as well as telecommunications and ICT.
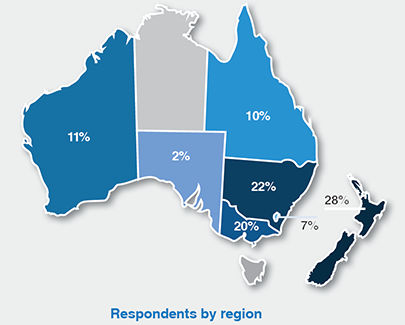
The portion of New Zealand responses continued to grow, with a quarter of responses coming from Auckland and Wellington combined. Medium-sized and large organisations were best represented in 2015, registering at 42 percent and 35 percent respectively, while organisations with under 100 staff comprised 23 percent of respondents.
Demand for Agile
2015 saw Agile advance its lead as the most prevalent methodology, coming in 11 percentage points higher than Waterfall, with these methods being used in 43 percent and 32 percent of projects respectively. Agile’s footprint increases further when examining where it is being practiced, as 88 percent of organisations are now applying Agile methods in some portion of their software projects.
These organisations reported applying a mix of Agile flavours, with 77 percent applying Scrum practices and 32 percent applying Kanban. Kanban was far more popular in New Zealand, where it is applied by almost half of ‘Agile’ organisations.
On the forefront of the Agile wave is the software development industry, with 61 percent of their projects following Agile methods. New Zealand organisations also prove to be eager adopters of Agile, which they apply in 54 percent of their IT projects, though less keen was Government at 27 percent.
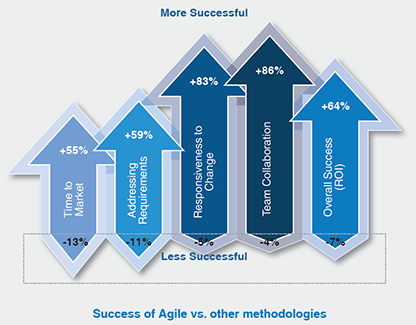
Positive market sentiment for Agile continues to grow, with 93 percent of respondents considering it to be as successful as, if not more successful than, other methodologies overall (up 7 points). The most significant advantages noted were in team collaboration and responsiveness to change, considered to be more successful by 86 and 83 percent of respondents respectively.
Success with V-Model
For the second consecutive year there was a slippage in project outcomes, with less projects completing on-time, budget and in-line with scope, falling by 3 percentage points. More alarmingly, project postponements and cancellations also increased, now accounting for a combined 15 percent of projects commenced - the highest level on record.
Organisations from Victoria marginally out-performed the regional average, with 45 percent of projects still completing in line with expectations. This was 11 percentage points higher than New South Wales, at 34 percent.

When examining outcomes against primary project methodology, V-Model clearly posted the highest levels of success, maintaining form from 2014. This included 41 percent of projects completing on time, budget and scope while postponed/cancelled projects were a third under the regional average at 11 percent.
Organisations primarily following either Agile or Waterfall both posted declines in form, with less projects completing in line with expectations and more projects failing to launch.
To read the full 2015 report, please visit the Planit Testing Index page.